









Data Visualization Services That Turn Numbers Into Decisions Your Team Understands at a Glance
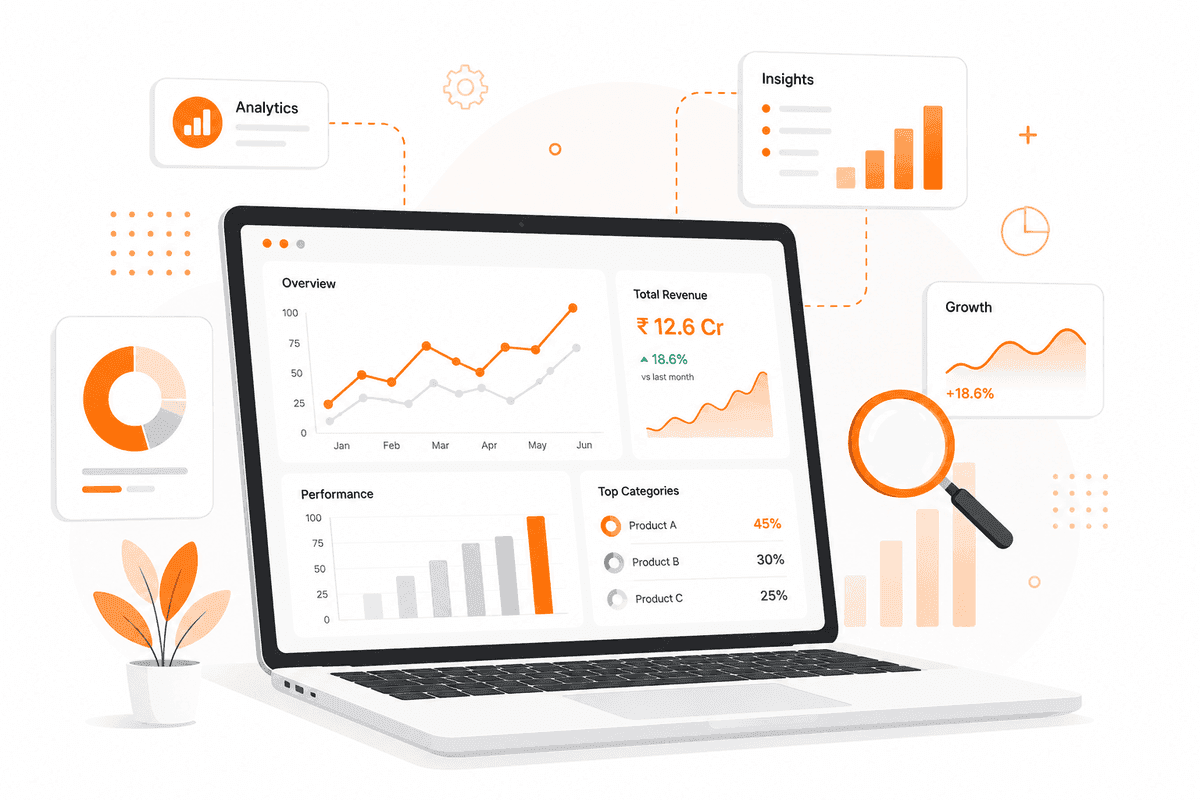
Most dashboards fail for one reason: nobody built them to be read in ten seconds. Data sits in the right place, the numbers are technically correct, but the story never comes through. So people end up asking someone to "just explain the chart" instead of acting on it. We're a data visualization company that fixes that. We design dashboards and reports that make sense the moment someone opens them, backed by data visualization consulting that figures out what your team actually needs to see, not just what a template happens to show. If your reporting still needs a five-minute walkthrough before every meeting, that's the problem we solve.

Data Visualization Services Built for Modern Businesses
Not every team is starting from the same place. Some are still stuck in static spreadsheets. Some have dashboards nobody trusts anymore. Some need numbers updating live, not refreshed once a week. Our data visualization services are built to meet you wherever that starting point is, with a data visualization consultant involved from day one so the work matches how your business actually runs, not a generic dashboard template.
Data Visualization Solutions Built Around How Your Industry Actually Works
No two industries read data the same way, and a one-size-fits-all dashboard rarely earns anyone's trust. As a data visualization company, we design around how your industry actually operates, from compliance-heavy reporting to shop-floor production monitoring, so the visuals you get are ones your team will actually rely on.


Technology Stack
We work with leading visualization platforms and cloud technologies.

Enterprise reporting & dashboards
Visual analytics & data storytelling
Self-service dashboard builds
Associative data exploration
Selected work
Real problems, real solutions — placeholder case studies pending client sign-off.
TODO: Describe the measurable result (placeholder only — no fabricated metrics).
TODO: Describe the client challenge — e.g., a dashboard nobody trusted anymore, or reporting that still needed a five-minute walkthrough before every meeting.
TODO: Describe the solution — e.g., a redesigned executive dashboard, a real-time monitoring view, an interactive drill-down report.
Duis aute irure dolor in reprehenderit in voluptate velit esse cillum dolore eu fugiat nulla pariatur.
Lorem ipsum dolor sit amet, consectetur adipiscing elit. Sed do eiusmod tempor incididunt ut labore et dolore magna aliqua.
Ut enim ad minim veniam, quis nostrud exercitation ullamco laboris nisi ut aliquip ex ea commodo consequat.
Nemo enim ipsam voluptatem quia voluptas sit aspernatur aut odit aut fugit sed quia consequuntur.
Excepteur sint occaecat cupidatat non proident, sunt in culpa qui officia deserunt mollit anim id est laborum.
Sed ut perspiciatis unde omnis iste natus error sit voluptatem accusantium doloremque laudantium.
How Do We Turn Raw Data Into Dashboards People Actually Use?
We bring together strategy, design, development, and ongoing refinement to build visualization solutions that scale with your business. The goal stays the same at every step: dashboards someone opens because they trust them, not because they have to.
Discover & Analyze
Understanding what your team actually needs to decide, and what's currently getting in the way, is where every engagement starts. No dashboard works if it's answering the wrong question.
- Analyze current reporting and pain points
- Map existing data sources
- Define KPIs and audience needs
Why Choose Our Data Visualization Company?
Building a chart isn't the hard part. Building one people actually trust and act on is. Our team brings together visualization expertise, modern BI tooling, and real industry context to deliver data visualization solutions that make reporting faster to read, easier to trust, and simpler to act on.
Certified Data Visualization Experts
Our team is made up of certified BI and analytics professionals who've designed dashboards across real industries, not just tutorials. Every data visualization consultant on our team starts by understanding your business before opening a design tool.
Scalable Cloud Architecture
We build dashboards on cloud-native BI infrastructure that keeps working as your data grows. Whether you're tracking one department or the whole business, the architecture is built to scale with you.
Secure Data Governance
Access control and data governance are part of the design, not an afterthought bolted on later. Sensitive figures stay visible only to the people who should see them.
Faster Project Delivery
Our agile design process means you're reviewing working dashboards early, not waiting weeks for a single big reveal. Speed doesn't come at the cost of accuracy here.
Industry-Specific Solutions
A dashboard for a pharma compliance team looks nothing like one for a distributor tracking dealer performance. We design data visualization solutions around how your specific industry actually reads data.
Ongoing Analytics Support
We don't disappear after launch. As your data sources change or new questions come up, we're still there refining the dashboard so it keeps answering the right questions.
Insights & Resources
Practical Insights on Data Visualization, BI & Dashboard Design. Practical, no-fluff writing on data visualization, BI tooling, and dashboard design the kind of thing we'd send a client, not generic trend pieces.


Frequently asked questions
Everything you need to know about working with us.
Stuck on How to Show Your Data?
Whether it's a dashboard nobody trusts, numbers that don't match across teams, or reporting that's still stuck in spreadsheets, tell us where you're stuck, and we'll help you find the fastest way forward.