
EPIC
Centralized, real-time enterprise intelligence replacing fragmented Excel-based reporting across business functions.
Project Overview
Industry
Enterprise Analytics / Business Intelligence
Team
What We Faced
Key obstacles that demanded innovative solutions and strategic thinking.
Data Fragmentation
Multiple departments operated in silos with no unified analytics platform or shared data visibility.
Manual Excel Dependency
Heavy reliance on Excel for reporting caused duplication, inconsistencies, and human errors.
Lack of Real-Time Visibility
Leadership and field teams lacked instant access to KPIs, trends, and operational metrics.
Slow & High-Effort Reporting
Manual report creation increased turnaround time and operational costs.
What We Aimed For
Centralize enterprise data across departments
Eliminate Excel-based manual reporting
Enable real-time, role-based analytics
Improve reporting speed, accuracy, and scalability
How We Solved It
Comprehensive solutions designed for scale, integration, and measurable impact.
End-to-End ETL & Data Modeling
Built scalable ETL pipelines from SAP with denormalized analytical models optimized for fast querying.
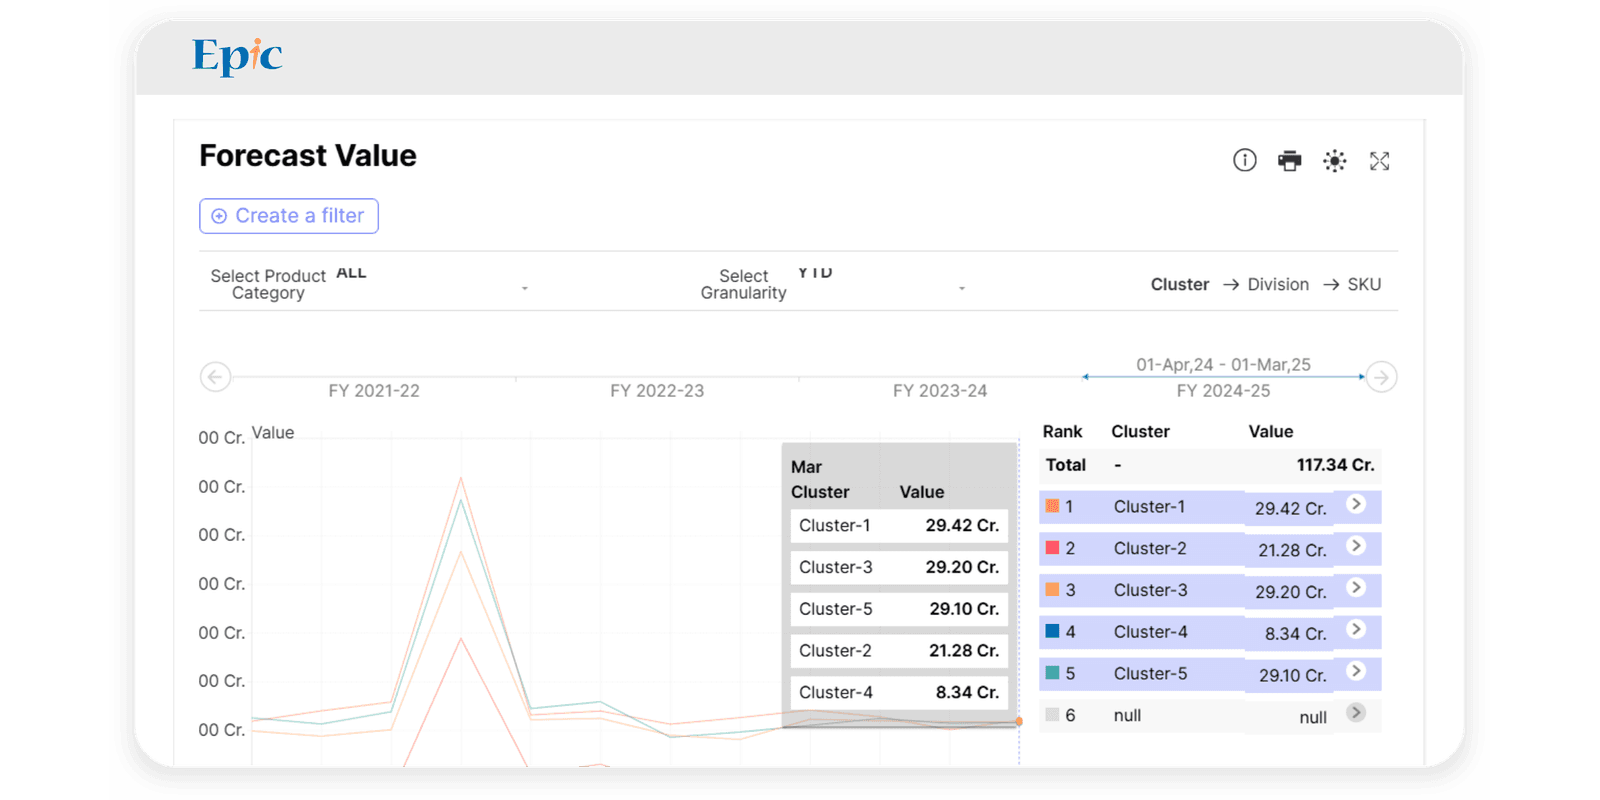
Widget-Based Dashboard Framework
Designed reusable, configurable widgets enabling rapid dashboard development.
Department-Specific Dashboards
Delivered ready-to-use dashboards for Sales, HR, Finance, Manufacturing, SFE, and Market Analytics.
Self-Service Analytics
Empowered business users to filter, drill down, and analyze data without technical dependency.
Automated Data Refresh
Implemented scheduled pipelines ensuring dashboards always reflected the latest data.
Impact Delivered
Tangible outcomes that transformed operations and drove measurable business value.
Reduced Manual Effort
All departments eliminated Excel-based reporting, significantly reducing manual work and errors.
Faster & Scalable Analytics
The widget-based architecture accelerated dashboard rollouts and future enhancements.
Improved Productivity
Role-based dashboards enabled teams to make faster, data-driven decisions.
Cost & Time Efficiency
Reporting cycles reduced from days to minutes, lowering operational costs.
Enterprise Data Transformation
Transitioned from fragmented reporting to a centralized, future-ready analytics ecosystem.