









Trusted Power BI Development Partner

Power BI Dashboard Development That Gives Your Team Numbers They Can Actually Trust

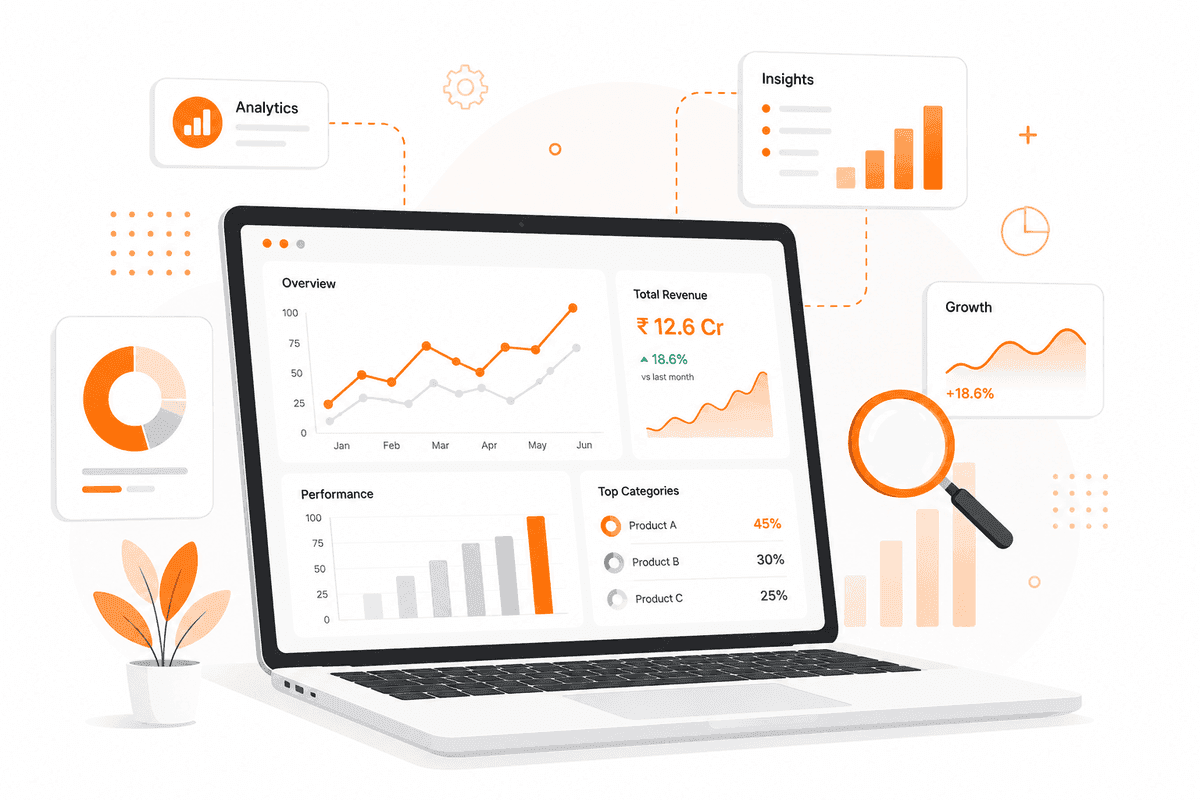
Most companies don't have a Power BI problem. They have a "three dashboards, three different revenue figures" problem. Someone built a report two years ago, someone else copied it, the data model grew sideways, and now every leadership meeting starts with a debate about whose number is right. Our Power BI dashboard development work starts by fixing what sits underneath the visuals: the model, the relationships, the DAX, the refresh schedule. Then we build dashboards that load in seconds, answer the question on the first screen, and don't need a person to babysit them every Monday morning.

Power BI Dashboard Development — Cephei Infotech
5,000+
Daily Users
9
Enterprise Clients
40+
Sources Unified
Trusted by data-driven teams
Our Capabilities

Power BI Development Services Built Around How Your Business Actually Runs

Every Power BI project starts from a different place. Some teams are still exporting Excel files and pasting them into a deck. Some have fifty reports in the workspace and nobody knows which four still matter. Some have a beautiful dashboard that takes eleven minutes to refresh and times out half the time. Our Power BI development services are built to meet you wherever you are and get the reporting layer back to something people rely on instead of work around.

INDUSTRY EXPERTISE

Power BI Dashboards Built Around Your Industry's Metrics

A retail team needs sell-through, shrink, and store comparisons. A hospital needs bed occupancy and readmission trends. A logistics operation needs on-time delivery and cost per mile. We've built Power BI dashboards across manufacturing, retail and e-commerce, healthcare, financial services, logistics, real estate, and professional services, and we come to the first call already knowing which metrics matter in yours and which data quality problems usually show up.

Pharmaceuticals
Pharmaceuticals
Clinical trials, manufacturing runs, and regulatory filings all generate data with different rules attached. We build secure analytics that keep compliance reporting audit-ready, forecast demand and supply needs, and give you real-time visibility into plant and trial performance.
Know more →
Building Materials
Building Materials
Distributors in this space live or die by inventory accuracy and dealer performance. Our BI services help you see stock levels across locations, forecast seasonal demand, spot underperforming dealers early, and tighten up supply chain visibility from plant to job site.
Know more →
Wire & Cable
Wire & Cable
Manufacturing downtime is expensive, and quality issues often show up too late to fix cheaply. We build reporting that flags production anomalies as they happen, tracks quality trends line by line, and gives your team the operational data to cut downtime before it compounds.
Know more →
Technology Stack

Technology Stack

The Microsoft data platform, end to end.

Power BI Ecosystem
Power BI Desktop

Report authoring & data modelling

Power BI Service

Publishing, sharing & scheduled refresh

Report Builder

Paginated, print-ready report design

Power BI Embedded

Reports embedded in apps & portals

OUR PROCESS

How Do We Take You From Messy Data to a Dashboard People Use?

Four stages, no surprises, and a working version in front of your team early enough that feedback still changes the outcome.

01

Discover & Analyze

Understand how your work gets done today. We walk through live workflows with your team, audit the systems and data behind them, and measure the manual effort so we can prove the change later.

  • Review workflows, systems & data quality
  • Identify automation opportunities
  • Set baseline metrics & success criteria
02

Design & Plan

Design how automation will work across your business. We map the workflow, integrations, AI decision points, permissions, approval gates, and failure paths before anyone writes code.

  • Design the automation architecture
  • Map APIs, data flows & authentication
  • Define AI thresholds & human checkpoints
03

Build & Validate

Turn the workflow into automation your team can rely on. We build in stages and validate against your real historical cases, including the edge cases your team handles manually today.

  • Build AI workflows, agents & integrations
  • Test accuracy, edge cases & failure handling
  • Run in parallel before full cutover
04

Launch & Improve

Put automation into production and keep improving it. We deploy into your environment, watch the first weeks closely, and refine thresholds and logic as real usage exposes what testing missed.

  • Deploy to your production environment
  • Monitor workflow performance & alerts
  • Improve as business needs change
Ready to start?

Turn Your Reports Into Decisions

From a single dashboard rebuild to a full Power BI rollout across departments, we help teams replace scattered spreadsheets with reporting they can open in a meeting without apologising for it.

WHY CHOOSE US

Why Choose Our Power BI Dashboard Services?

Anyone can drag a field onto a canvas. The difference shows up six months later, when the dataset has tripled, three people have edited the same report, and the CFO asks why last quarter's number moved. We build Power BI the way it's meant to be built: a clean semantic model, documented measures, tested refresh, and governance that holds up as more people get access.

Certified Power BI Developers

Our Power BI developers hold Microsoft data analyst and engineering certifications and have delivered reporting for finance, retail, manufacturing, healthcare, and logistics teams. We ask about your close process and your KPI definitions before we ask about your data sources.

MSCertified Team

Dashboards That Load Fast

Slow reports don't get used. We optimize at the model level with star schemas, correct cardinality, aggregation tables, and DAX that doesn't scan the whole fact table for a single card. Most rebuilds we take on come back significantly faster than what they replaced.

3xFaster Load Times

Governance and Row-Level Security Built In

Sales sees sales. Regional managers see their region. Finance sees everything. We set up row-level security, sensitivity labels, and workspace permissions from day one rather than bolting them on after someone sees a number they shouldn't have.

100%RLS on Every Build

One Version of the Truth

We consolidate duplicate measures, agree KPI definitions in writing with your team, and publish shared datasets so every report pulls from the same logic. That's the difference between a dashboard people check and a dashboard people argue with.

1Single Semantic Model

Industry-Specific Reporting

A manufacturing OEE dashboard and a SaaS retention dashboard have almost nothing in common. We build around your industry's metrics, reporting cycles, and compliance requirements instead of reshaping your business to fit a template.

40+Data Sources Supported

Ongoing Support After Go-Live

Source systems change, columns get renamed, gateways drop, and someone always asks for one more slicer. We stay on for monitoring, refresh troubleshooting, enhancement requests, and periodic model health checks.

<24hSupport Response
FAQ

Frequently asked questions

Everything you need to know about working with us.

Power BI dashboard development is the full process of turning raw business data into interactive dashboards inside Microsoft Power BI. It covers connecting and cleaning data sources, building a data model, writing DAX measures, designing the report pages, and publishing with the right refresh schedule and security. Dragging charts onto a canvas is maybe fifteen percent of the work. The model underneath is what determines whether the dashboard stays accurate and fast.

It depends on how many sources need connecting and how clean the data is. A focused single-dashboard build on a tidy SQL source is a small, fixed-scope engagement. A full implementation with data modelling, multiple integrations, security roles, and training runs considerably higher. We give you a fixed quote after discovery, not a range before it, and we'll tell you if your problem is small enough to not need us.

Yes, and it's a large share of what we do. Common fixes include slow refresh, reports timing out, numbers that don't reconcile with finance, and models built entirely from flat tables. We audit the existing file, document what's wrong, and give you the option to optimize in place or rebuild the model properly.

For most mid-sized teams, Power BI Pro is enough. You typically move to Premium Per User or Fabric capacity when you need large datasets, more frequent refreshes, paginated reports at scale, or you want to consolidate your data engineering into the same platform. We'll walk you through the licensing maths against your actual user count before you commit to anything.

A single well-scoped dashboard on existing clean data usually takes two to four weeks. A department-level implementation with several integrations and security roles runs six to twelve weeks. A full enterprise rollout with migration and training is a multi-month program. After discovery we give you a dated plan, and you'll see a working draft well before the end date.
Let's collaborate

Stuck on a Power BI Problem?

Refresh failing, numbers not matching, a dashboard nobody opens, or a rollout that stalled halfway? Tell us where it broke and our Power BI developers will tell you what's actually causing it and what the fastest fix looks like.

5,000+Daily Users
9Enterprise Clients
40+Sources Unified