










Trusted Data Reporting Partner

Data Reporting Solutions That Turn Scattered Numbers Into Decisions You Can Defend

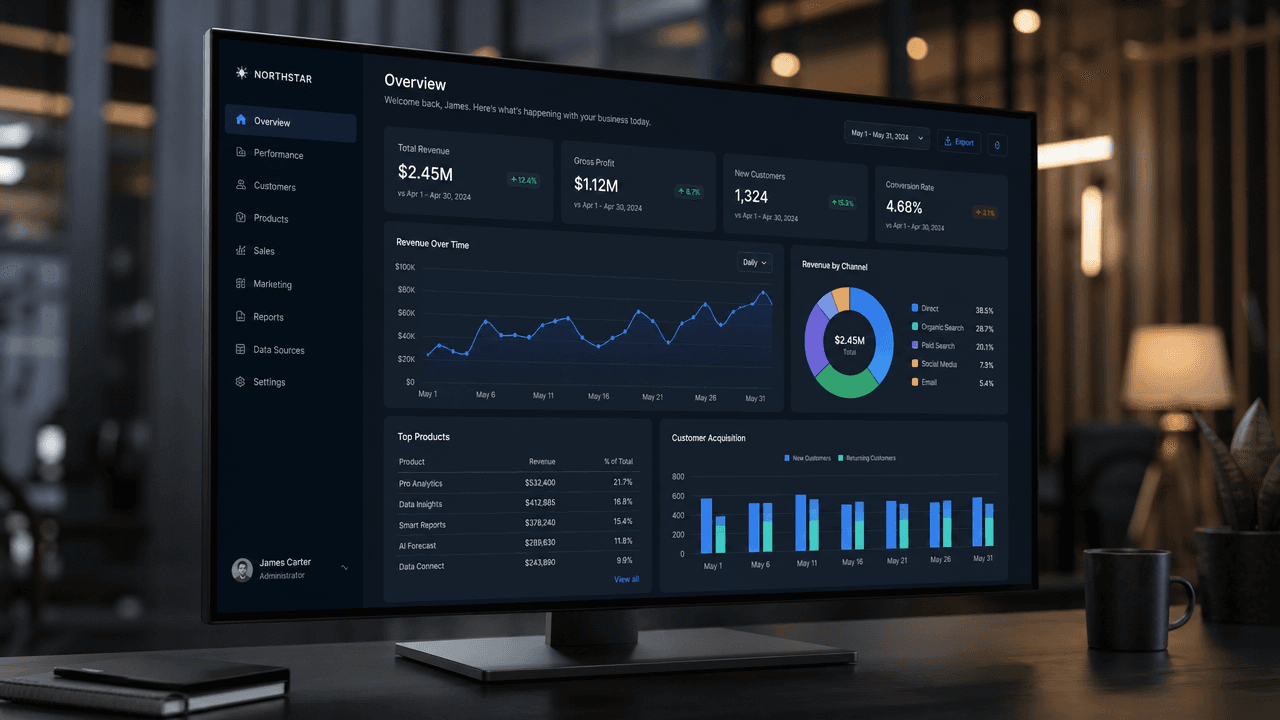
Most teams don't have a data problem. They have a reporting problem. Numbers live in five systems, three people export them by hand, and the finance sheet never quite matches the sales dashboard, so meetings turn into debates about whose figure is correct instead of what to do next. Our data reporting solutions fix that at the root: we connect your sources, agree on one definition for every metric, and automate the reporting so the numbers show up on time, refreshed, and consistent everywhere they appear. If someone on your team still spends Monday morning building a report by hand, this page is written for you.

Data Reporting Solutions — Cephei Infotech
5,000+
Daily Users
9
Enterprise Clients
40+
Sources Unified
Trusted by data-driven teams
Our Capabilities

Data Reporting Services Built for Teams That Need Numbers They Can Trust

Every business hits a different wall with reporting. Some have twenty dashboards and no clarity. Some can't close a month without three days of manual work. Some are still emailing spreadsheets to clients because the platform never gave them a proper report. Our data reporting services are built to meet you at whichever wall you've hit and get you past it without a two-year platform overhaul.

INDUSTRY EXPERTISE

Data Reporting Solutions Built Around Your Industry

No two industries measure success the same way, and that's exactly why generic reporting templates disappoint. Retail lives on stock turn and margin, SaaS runs on retention and MRR, manufacturing watches downtime and yield, and healthcare and finance carry reporting obligations they can't negotiate. Our data reporting services are shaped around your industry's metrics, reporting calendar, source systems, and regulatory requirements from the first workshop onwards.

Pharmaceuticals
Pharmaceuticals
Clinical trials, manufacturing runs, and regulatory filings all generate data with different rules attached. We build secure analytics that keep compliance reporting audit-ready, forecast demand and supply needs, and give you real-time visibility into plant and trial performance.
Know more →
Building Materials
Building Materials
Distributors in this space live or die by inventory accuracy and dealer performance. Our BI services help you see stock levels across locations, forecast seasonal demand, spot underperforming dealers early, and tighten up supply chain visibility from plant to job site.
Know more →
Wire & Cable
Wire & Cable
Manufacturing downtime is expensive, and quality issues often show up too late to fix cheaply. We build reporting that flags production anomalies as they happen, tracks quality trends line by line, and gives your team the operational data to cut downtime before it compounds.
Know more →
Technology Stack

Technology Stack

We work with leading BI, data, and cloud technologies.

Business Intelligence
Power BI

Enterprise dashboards & Microsoft ecosystem fit

Tableau

Visual analysis & exploration

Looker Studio

Lightweight, shareable reporting

Qlik

Associative, governed analytics

OUR PROCESS

How Do We Turn Scattered Data Into Reporting You Can Rely On?

We combine discovery, data engineering, dashboard design, and ongoing support to deliver reporting that survives real use. Business decisions stay at the centre of every stage, from the first call to the reports running quietly in the background months later.

01

Discover & Analyze

Understand how your work gets done today. We walk through live workflows with your team, audit the systems and data behind them, and measure the manual effort so we can prove the change later.

  • Review workflows, systems & data quality
  • Identify automation opportunities
  • Set baseline metrics & success criteria
02

Design & Plan

Design how automation will work across your business. We map the workflow, integrations, AI decision points, permissions, approval gates, and failure paths before anyone writes code.

  • Design the automation architecture
  • Map APIs, data flows & authentication
  • Define AI thresholds & human checkpoints
03

Build & Validate

Turn the workflow into automation your team can rely on. We build in stages and validate against your real historical cases, including the edge cases your team handles manually today.

  • Build AI workflows, agents & integrations
  • Test accuracy, edge cases & failure handling
  • Run in parallel before full cutover
04

Launch & Improve

Put automation into production and keep improving it. We deploy into your environment, watch the first weeks closely, and refine thresholds and logic as real usage exposes what testing missed.

  • Deploy to your production environment
  • Monitor workflow performance & alerts
  • Improve as business needs change
Ready to start?

Turn Reporting Into Something Your Team Actually Relies On

From reporting audits and data integration to automated data reporting and custom dashboard builds, we help businesses replace manual, inconsistent reporting with a setup that runs on its own and tells the truth.

WHY CHOOSE US

Why Choose Our Data Reporting Solutions?

Collecting data was never the hard part. The value shows up when reporting is fast, consistent, and trusted enough that nobody double-checks it in a side spreadsheet. We combine data engineering, BI expertise, and industry context to build business reporting solutions that hold up as your data grows and your team changes.

Certified BI & Data Engineering Experts

Our team works across data modeling, warehousing, and BI platforms every day, and has shipped reporting into live business environments where finance and operations depend on it. We start with the decisions you need to make, then design the reporting around those decisions.

24/7Availability

Scalable, Cloud-Ready Reporting Architecture

We build cloud-native reporting foundations that hold up as row counts grow and more teams get access. Your dashboards stay fast at ten million records, not just at ten thousand, because the modeling is done properly underneath.

99.9%Uptime

Governed, Secure & Audit-Ready Reporting

Access control, row-level security, and clear data lineage are part of the build, not a later add-on. You'll know where every number came from, who can see it, and how it was calculated, which matters as much for internal trust as it does for audits.

0Breaches

Faster Time to First Report

Our reusable reporting frameworks and templated pipelines cut the gap between kickoff and something usable in your hands. We ship a working report early, get your feedback on real numbers, and iterate from there instead of disappearing for a quarter.

3xFaster

Industry-Specific Reporting Models

A manufacturing plant, a SaaS company, and a hospital group don't report on the same things or answer to the same regulators. We build around your industry's metrics, reporting cycles, and compliance requirements rather than forcing your data into a generic template.

40+Data Sources Supported

Ongoing Reporting Support

Reporting doesn't stay finished. Systems get replaced, fields get renamed, and definitions drift. We monitor pipelines, fix breakages, and update reports as your business changes so the numbers stay reliable long after handover.

<24hSupport Response
FAQ

Frequently asked questions

Everything you need to know about working with us.

Data reporting solutions are the systems and processes that collect data from your business tools, clean and standardize it, and present it as reports and dashboards people can act on. A complete solution covers four things: the data connections, a governed layer where metrics are defined once, the reports or dashboards themselves, and the automation that keeps everything refreshed without manual work.

The two overlap, and the line is more practical than technical. Data reporting services focus on getting accurate, consistent numbers delivered reliably, on schedule, in the format people need. Business intelligence reporting services go a step further into exploration, letting users slice, filter, and answer their own follow-up questions. Most businesses need both, and we usually stabilise the reporting first because self-service on top of messy data just spreads the mess faster.

Often, yes. Plenty of dashboards are fine visually and just sit on a weak data model or a broken refresh. We audit what you already have, keep what works, and rebuild only the parts causing the trust or performance issues. A rebuild recommendation from us comes with a reason, not a default.

It depends on what you already own, how technical your users are, and how much customization you need. We work with Power BI, Tableau, Looker Studio, and Qlik, plus SQL, dbt, and cloud warehouses underneath. If you're already on Microsoft 365, Power BI is usually the pragmatic answer. We'd rather make your existing licence work harder than sell you a migration you don't need.

It depends on scope and how clean your sources are. A focused dashboard build on existing, tidy data can take a few weeks. A full setup with multiple integrations, a warehouse, and automated data reporting across departments usually runs a few months. After discovery, we give you a realistic timeline tied to your actual sources and integrations rather than a generic estimate.
Let's collaborate

Stuck on a Reporting or Data Decision?

Reports nobody trusts, numbers that don't match, month-end that eats three days, or a dashboard project that stalled halfway? Tell us where you're stuck and our reporting specialists will help you figure out the right approach and the fastest path to numbers you can act on.

5,000+Daily Users
9Enterprise Clients
40+Sources Unified